Looking at market opportunities from different dimensions to generate constructive discussions in which most of the enterprises try to achieve the best result for the business as a whole.
As an enterprise you need to quantify whether you improved your productivity and have optimized cost with cloud deployments. How does your organization’s leadership team correlate and compare which cloud vendor is more cost effective for you? Or which region is proving to be more expensive than the others. Do you have tagging guidelines in place to ensure accountability for the cloud resources? The solution lies in having the right set of cloud analytics tools such as dashboards and reports, to visualize and analyse the available data. Jamcracker cloud platform allows your business model to adapt to different markets along with a better understanding of the changing behavioural patterns and customer’s expectations across different regions.
Multi-Cloud Model
Jamcracker multi-cloud model brings greater control over cloud business data, usage and cost, it helps you to take quick and efficient decisions about your cloud spend by lowering costs and building greater flexibility in your IT strategy. The Platform’s reporting capabilities backed by a comprehensive set of technological and functional features offers unmatched effectiveness and ease of use to both business customers and IT administrators. An advanced encryption technology that can effectively protect your data from tampering, interception and cracking.
The platform delivers a wide range of analytical capabilities – such as Interactive Dashboards, Standard Reports, Custom Reports, Offline Reports and many more. These advanced reporting data and visualization tools provide better insights into your cloud consumption and usage trends. With multi-cloud support, enterprises can increase agility, minimize vendor lock-in, take advantage of best-in-breed solutions, improve cost efficiencies, and increase flexibility through choice.
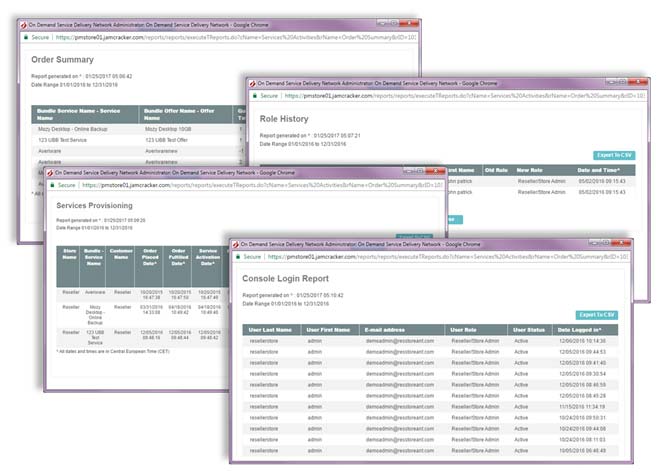
Standard Reports
Standard reports are a set of predefined reports that are readily available straight out of the platform. These are accessible with "few clicks" and available across the product layers. The administrative and customer portals of the platform provide a wide selection of standard reports, included among the reports are login activities, service activities, order management, cloud usage, billing, and helpdesk related reports. The platform allows users to generate reports in HTML or downloadable CSV format. The platform provides better security for the reporting data with data level RBAC (Role Based Access Control) mechanism and the data can be accessed or restricted based on role.
Custom Reports
Custom reports suit the best when you need to go beyond the information provided in the standard reports and want deeper insight into certain activities. With custom reporting, you can decide what you want to make available in the reports. All you need to do is select the columns/fields from the provided data sets (DataMart) and run the report or save them for running any time again.
Among the custom reports you can create using data marts, the Daily Consumption Report deserves a special mention because of its immense usefulness.
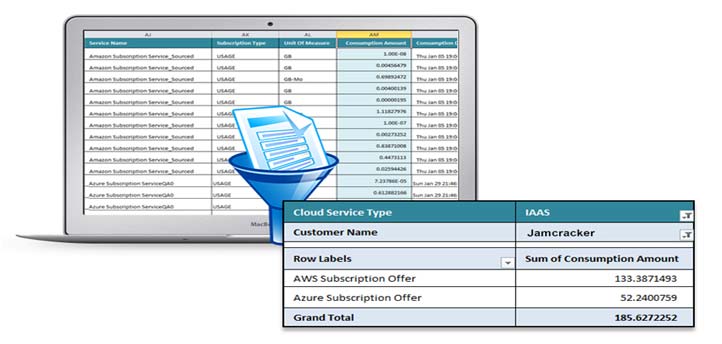
Daily Consumption Custom Report
The Daily Consumption Report tracks organization’s cloud consumption details and provides granular level information about cloud usage and cost. Using the fields available in the daily consumption datamart, you can create various reports with the combination of product type, usage type,charge type, currency, quantity, unit price, unit quantity, consumption amount and so on. You can customize the report data to aggregate the cost and usage information based on a single day or for a specific period.
For example, with daily consumption report, it is easy to generate the report of a linked account’s usage of Amazon EC2 service on a particular day. Another example could be calculating how much each department has spent on a particular service offer by generating reports of resources based on tags. You can also use the daily consumption report to compare the cloud consumption cost between various vendors. These are just few instances. The benefits and capabilities that that this report data can provide is tremendous. It allows you to easily view and comprehend your cost and usage report data and use them for better business decision making.
Offline Reports
The platform’s sophisticated offline reporting capability supports generating large reports offline and notifies respective users to download the report without impacting the performance of the live system. As an administrator, you can configure the type of reports that can be generated offline based on the requirements.
Such reports will not be displayed on the screen rather they will be listed on the Request Reports page. Once the report is available on the Requested Reports page, you will receive a notification, and then you download the reports in csv format.
Inventory/Live Dashboard
The goal of the Inventory dashboard is to provide organizations with actionable business intelligence (BI) to make stronger business decisions and learn from ongoing data collection. One of the key aspects of the live dashboard is to provide real time information of the resources being consumed. With the latest available data set, you as an IT Administrators have a powerful tool to track resource utilization across different providers, regions and accounts. The dashboard allows them to react in a proactive way rather than being reactive.
Resource Utilization Dashboard
This is an extension to the Inventory dashboard where you (IT Administrator) can view the resource utilization and performance of individual resource components. The dashboard provides Virtual machine, CPU utilization for last 2 or 7 or 30 days along with peaks and lows. It also provides the ability to select the time interval of the utilization data for CPU, Disk Read and Write, Network In and Out etc., to ensure the selected resource utilization is optimized.
Reserved Instance Dashboard
The Reserved Instances (RI) dashboard has a user-friendly interface and reporting features that gives you (IT Administrator) a clear idea about reserved instance usage vs on-demand usage, RI running hours, coverage rate, burndown hours, and much more across different providers. RI dashboard provides cost effective options, which helps an organization to optimize their cloud cost.
Recommendation Dashboard
Recommendation dashboard helps one to optimize cloud cost by identifying and listing underutilized or unused resources, you (IT Administrator) can take necessary actions accordingly. The widgets framework can be integrated with any external recommendations engine to obtain and display recommendations, which is customizable.
Executive Dashboard
The Executive Dashboard tracks key cloud vital trends such as costs and resources in order to help DevOps, IT Managers, CIOs, CTOs and Finance departments oversee total cloud costs by provider, by product and by resources centrally and to act upon them.
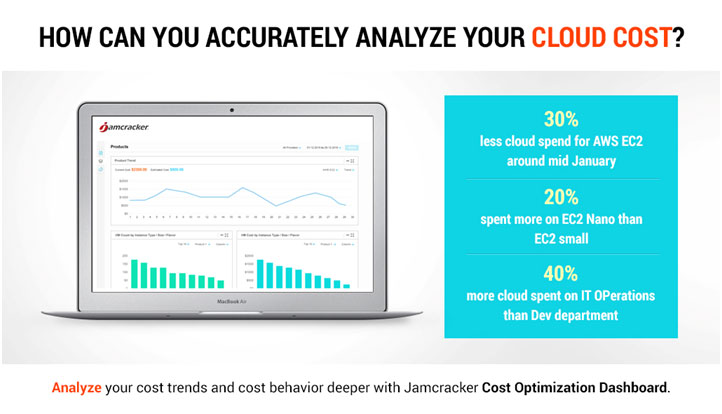
Cost Analysis Dashboard
The cost analysis dashboard provides visibility to an organization’s cloud usage and cost. It helps you (IT Administrator) filter your data on demand, view cost and usage data based on various parameters using a variety of visualizations and dig deeper to get better visibility.
Tag Analysis Dashboard
You (IT Administrator) can organize your resources based on tags and provide the ability to categorize them for billing purposes. Tag Analytics dashboard helps you analyse the cost of resources that represent different business categories (such as cost centres, departments, projects, groups) and provides visibility allowing asset management, security, and compliance tracking.
Cost Forecast Dashboard
The cost forecast dashboard helps you (IT Administrator) get the most out of your spend data, it lets you drill down to costs based on different providers, accounts and provides information, using which you can optimize the size, spend and scale of your cloud deployments.
Budget Analysis
As enterprises begin to deploy Cloud Services within their business across business units, budgets are allocated to departments/projects/cost centres. Budget analysis dashboard helps you to visualize the variances of actual vs budget.
In Summary, with better cloud analytics tools, enterprise IT Administrators are better equipped to govern, manage and control the cloud resources. Given today’s granular cloud services pricing model and frequent pricing breaks offered by the cloud services providers, keeping close tab on the cloud cost through rich cloud analytics is of paramount importance for cloud cost management. We hope that you can take advantage of the cloud analytics engine in the Jamcracker Cloud Platform and be smooth sailing as you navigate through the cloud transformation that’s happening all around you.